
In a previous article, we covered the total overview of the Universal Analytics dashboard. We broke down each section into a comprehensive summary of the data Google collects from visitors to your website. In this article, we will focus primarily on the Audience section. It is important to note that Universal Analytics is limited to collecting data from websites. In October 2020, Google activated the most updated version of Google Analytics called G4, which tracks websites, apps, and websites + apps together. We covered everything you need to know about G4 in this article, but we recommend reading the official announcement here.
Audience Overview Recap
This data shows you an in-depth view of users. For example, the data indicates if the visitors are new or returning, page engagement, session duration, demographics, primary interests, type of device used to view your website, visitor’s location, and browser type.
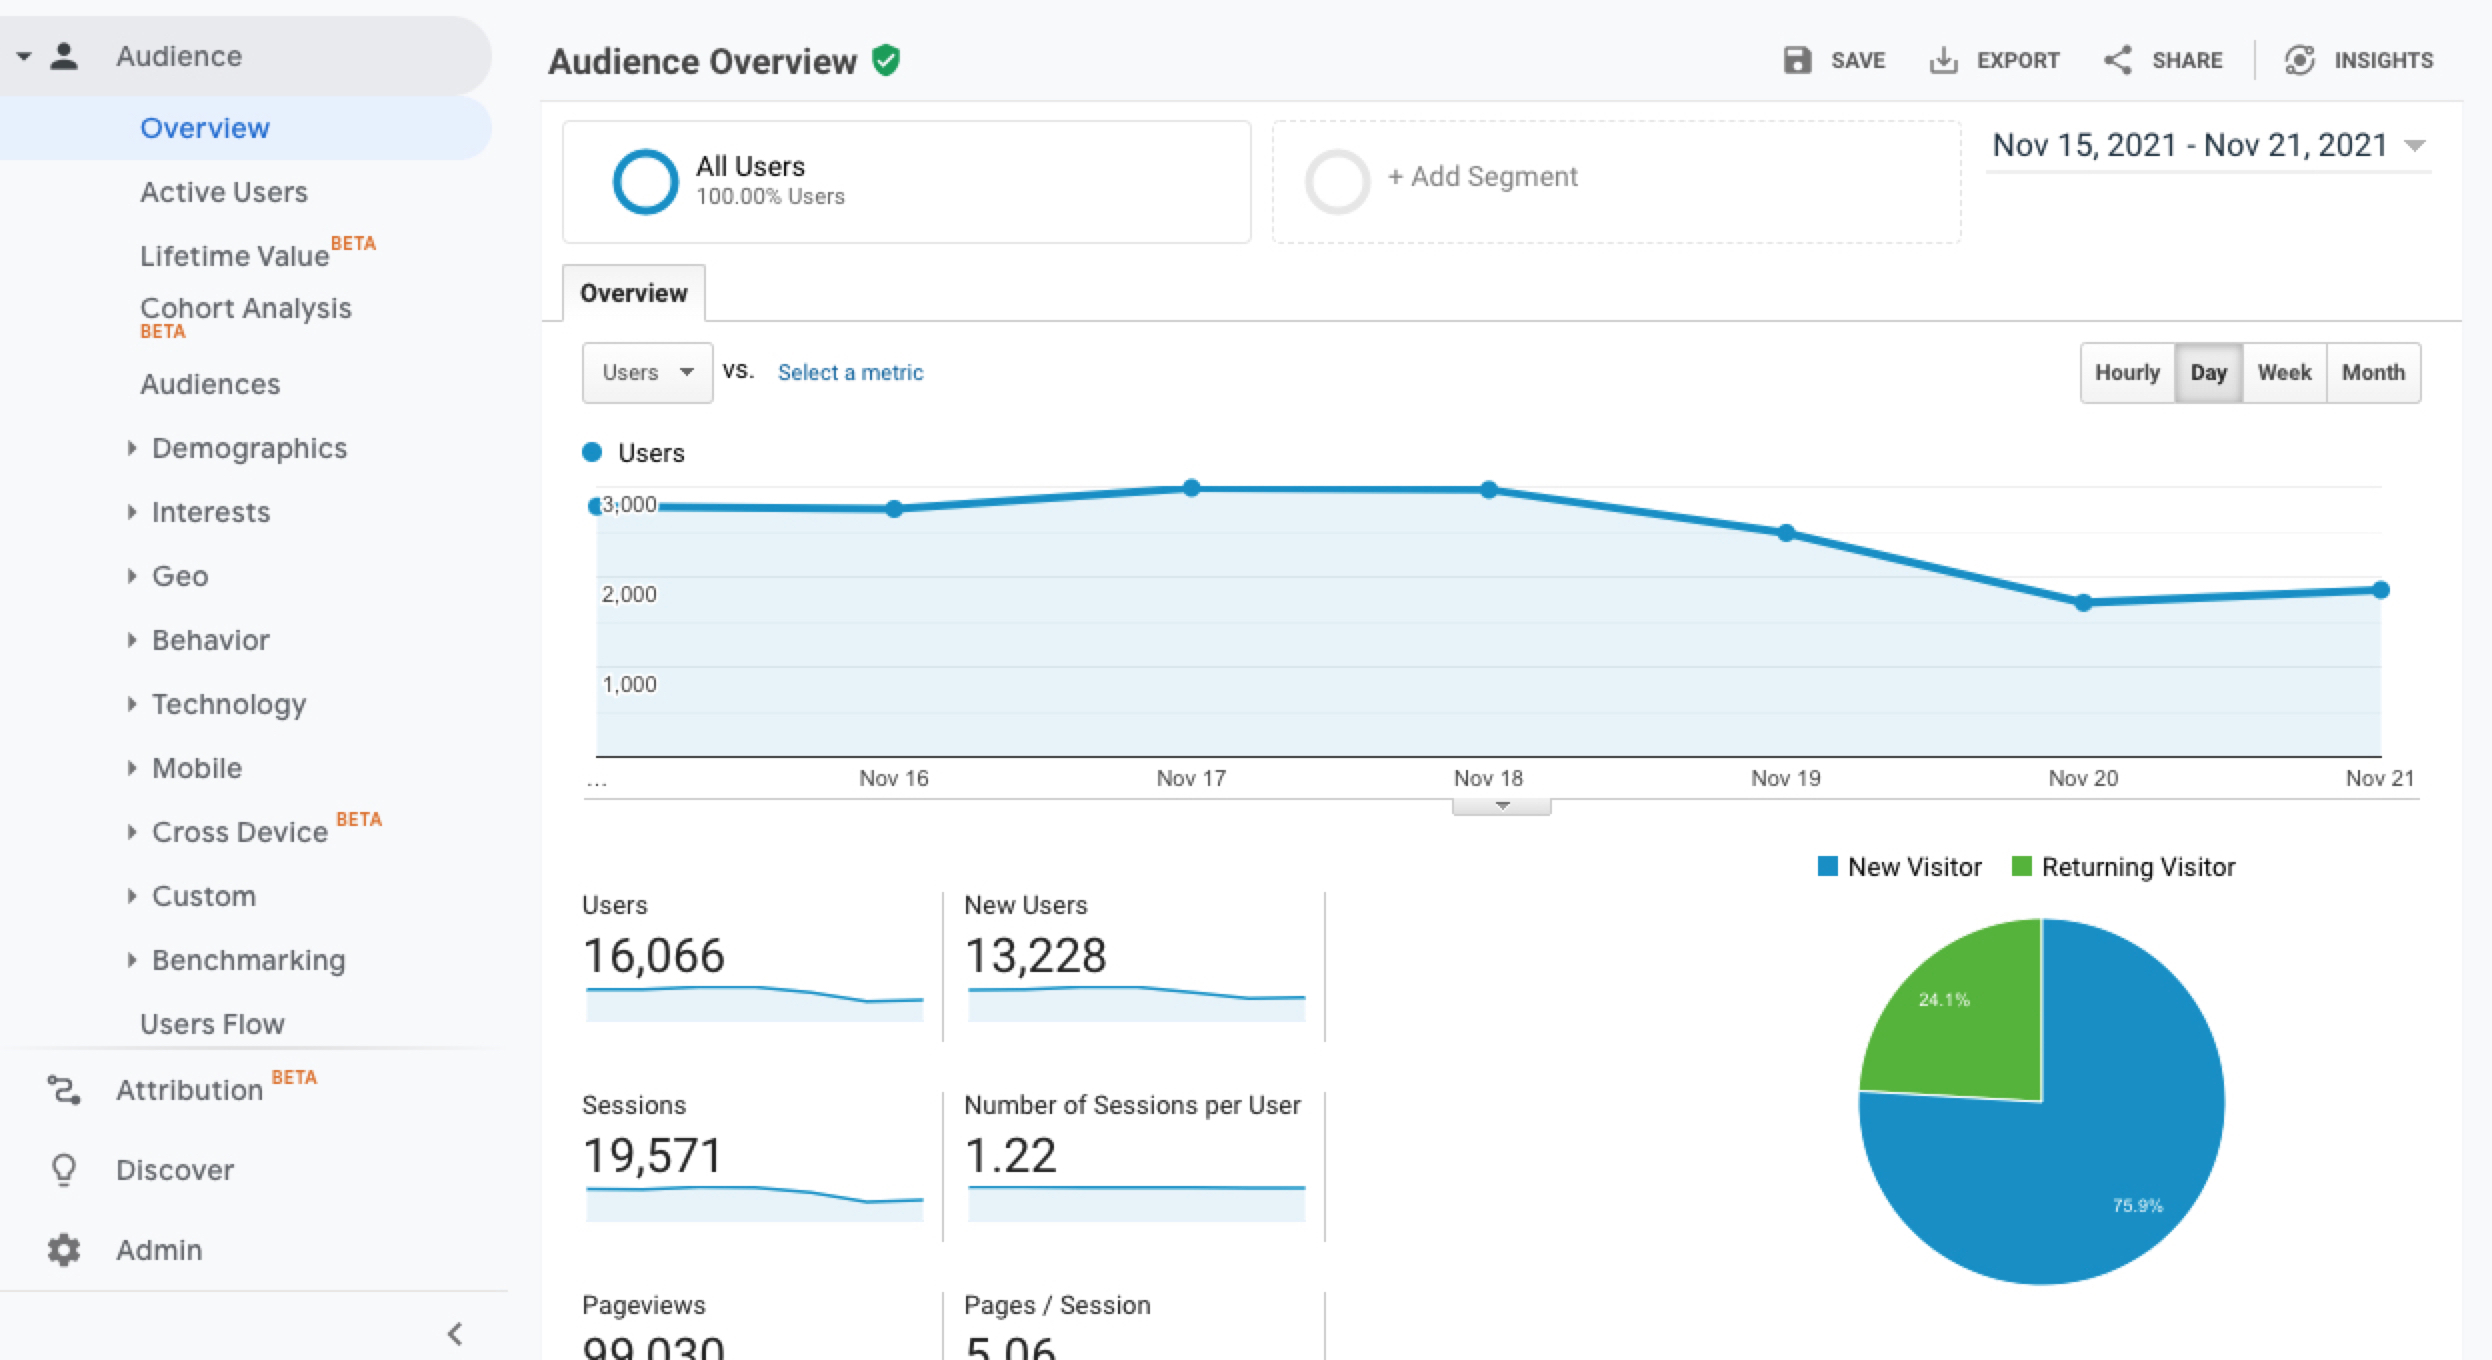
Ten (10) sections within the Audience Overview give analysts a general idea about the users themselves. These data sets help website and SEO developers understand the user’s origins, primary device and operating system (OS), and search preferences or insights.
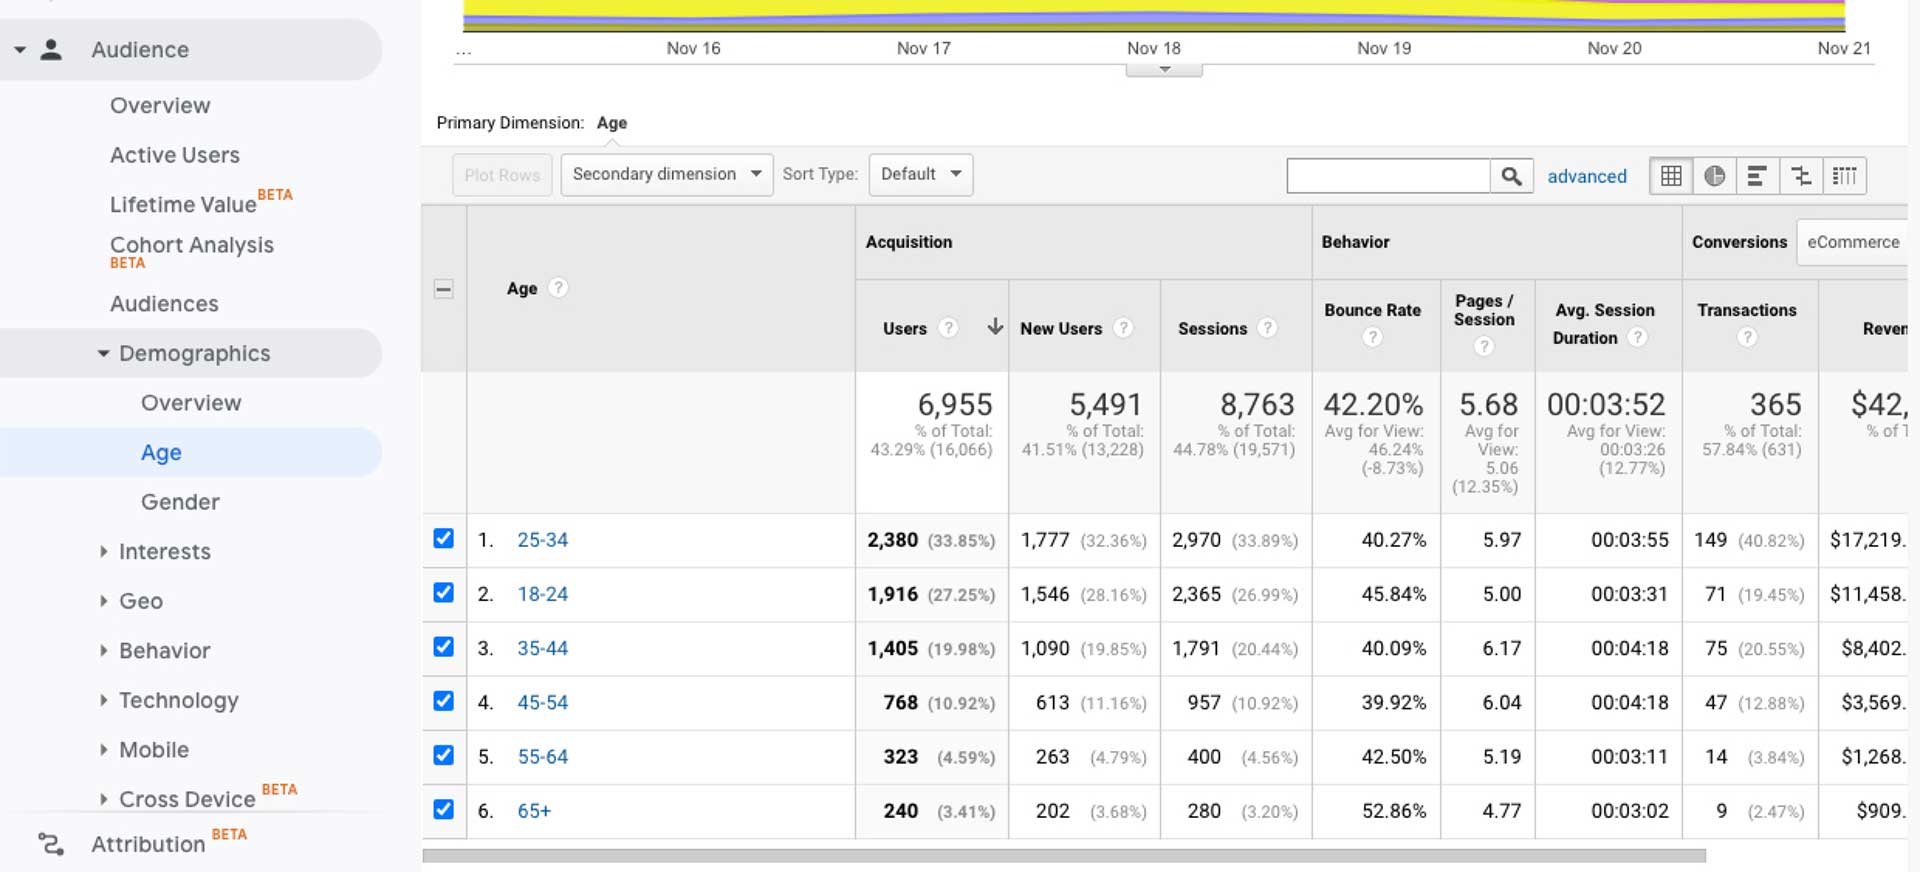
Demographics
This section covers two (2) segments: Age and Gender. This type of data helps strategists recommend and develop page content targeting the demographic consuming it most frequently. For instance, a website featuring a clothing line targeting females ages 18-24 would want to tailor their content to appeal to users within that specific demographic to increase visitors within that age range.
Interests
The best way to understand this segmentation is to give a real-world scenario. For example, if most of your audience likes more movies and entertainment and less weather and business, consider creating content that references the interests and trends that appeal to your audience. Doing this will increase engagement and encourage return visits.
Geo
This data handles language and location. Using the country codes, analysts can know whether the content reaches the correct audience. Geolocation data is crucial for websites with a global audience to deliver content in the proper language format. Websites focusing primarily on a specific country or language can segment reports to show only these statistics.
Behavior
- New vs. Returning – Records new and returning visits to a site, including sessions, bounce rates, pages per session, session duration (time on site), and any eCommerce stats (if any paid campaigns are connected).
- Frequency & Recency – Records count of sessions, days since the last session, sessions (numeric), and page views.
- Engagement – Records session duration in varying sequential steps (1-10, 11-30, 31-60, etc.), page depth, sessions, and pageviews.
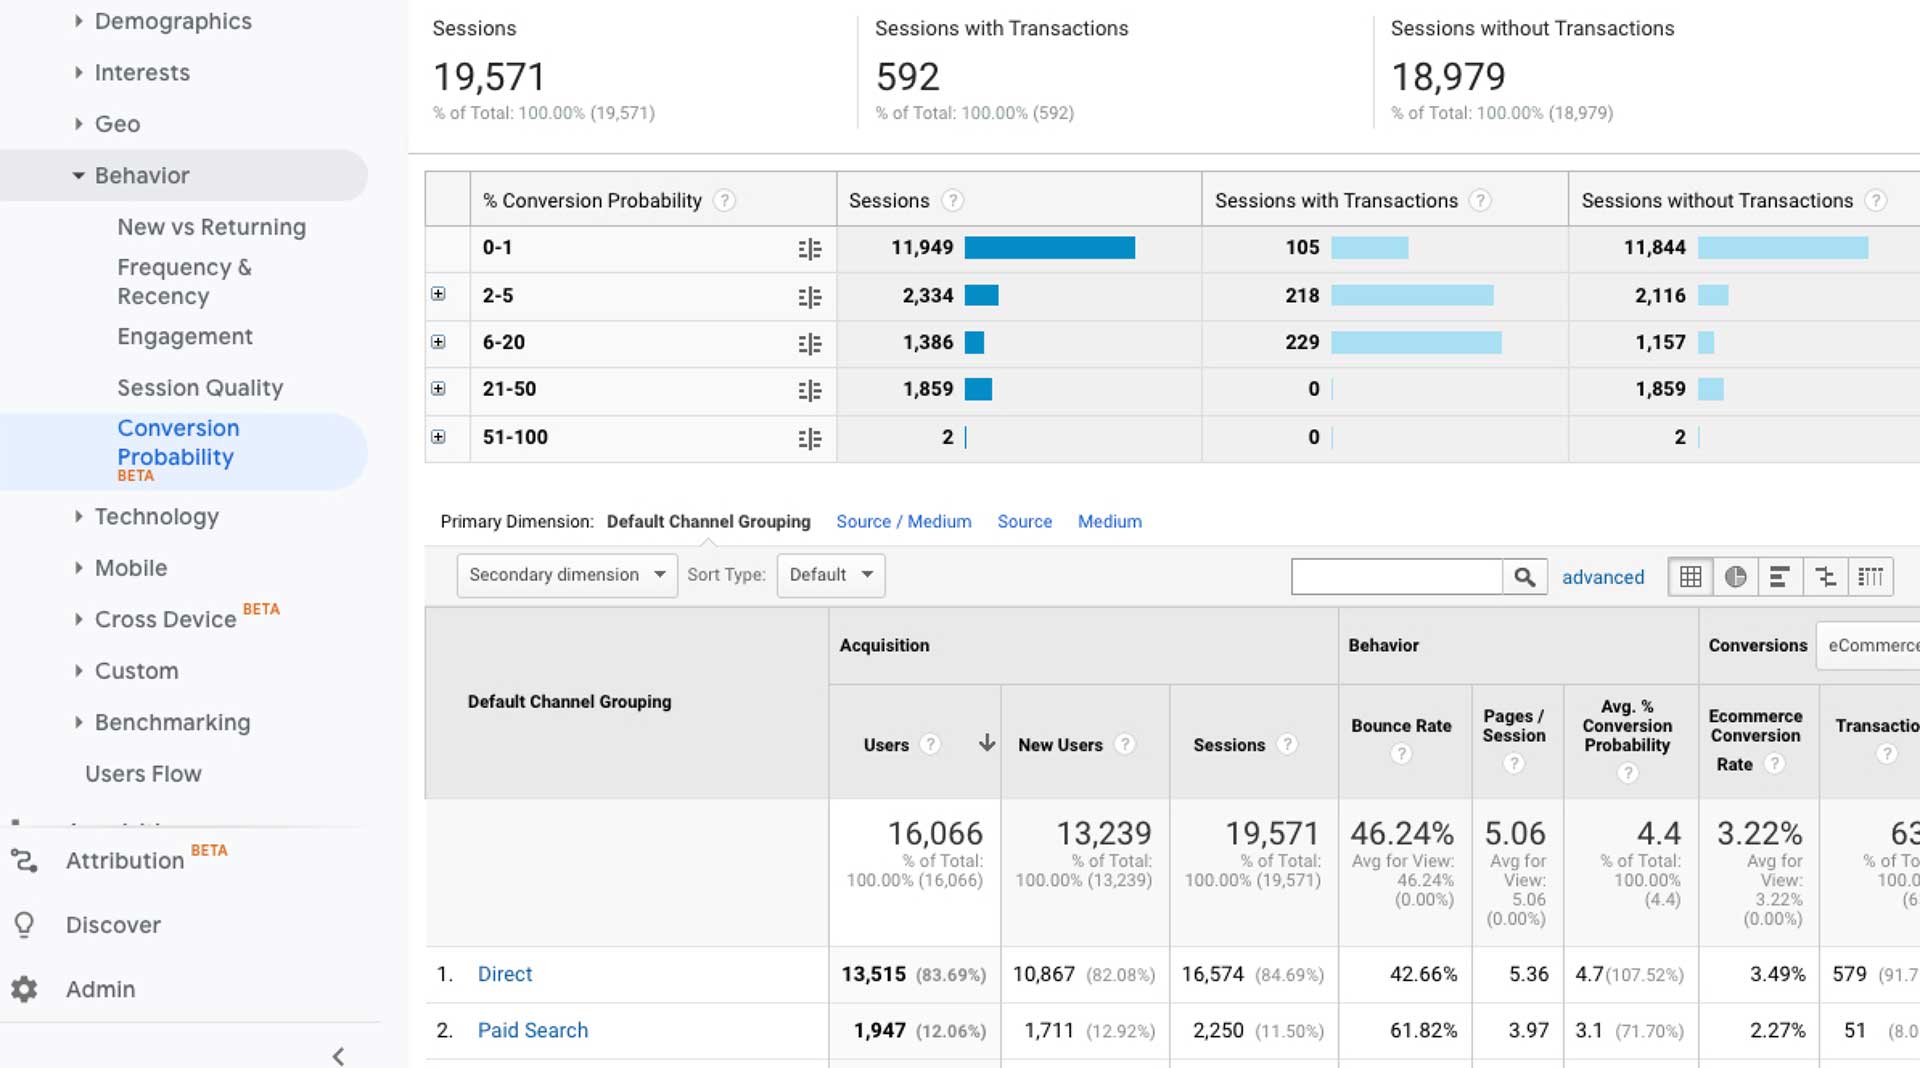
- Session Quality – This eCommerce segment uses ranged scoring to determine the user’s proximity to conversion. For an in-depth explanation of Session Quality, click here.
- Conversion Probability (Beta) – This is also an eCommerce segment that scores a user’s behavior to calculate the probability of conversion and attaches a value based on sessions, page views, etc. For an in-depth explanation of Conversion Probability, click here.
Technology
This segment collects data on a website visitor’s browser, operating system, screen resolution, screen colors, and records sessions, pageviews, bounce rates, and more. As a result, web developers and SEO experts gain valuable information that can be used in desktop, tablet, and responsive mobile design to enhance user experience.
Mobile
This segment deals specifically with devices: Desktop, tablet, and mobile. As in the case of technology, developers and content strategists use this data to determine and measure whether sites provide a good user experience. Mobile info records sessions, pageviews, bounce rates, and other dimensions.
Cross-Device
The best way to define Cross-Device is to think of a user having more than one type of device – desktop, tablet, and mobile – and starting their buyer’s journey on one device and returning to a website to complete a purchase on another. For example, it is not uncommon for a website visitor to start browsing on a desktop, find a product or service of interest, close the session, and return later to revisit the product or service and purchase it on a mobile device. This segment helps analysts understand how devices are used and which are preferred or more commonly used in conversion.
Custom
As of October 14, 2020, this segmentation has been deprecated and is no longer part of their reporting. Learn more about deprecated property types by clicking here.
Benchmarking
- Channels – A company can choose from over 1600 industry categories and then compare data from other companies who share their data.
- Location – Takes that same industry vertical and compares by location.
- Devices – Using the same industry vertical, makes comparisons based on desktop, tablet, and mobile.
User Flow
Allows analysts to set any desired dimension, such as an advertising keyword, and follow the user flow through their site visit. A lot of valuable information is gained by analyzing which pages users prefer and engage with and other pages that can be improved or eliminated. It isn’t just the good numbers to pay attention to; it’s also underperforming pages that should be looked at to enhance the overall user experience.
Summary
The foundational principle in collecting these types of metrics is to deliver the best user experience possible. It is also important to remember that Google rewards websites that continuously improve the user experience and produce quality content. Self-reflection is both a pain point and a learning experience. Meeting your users’ needs will result in quality users, qualified leads, and concrete conversions.
If you want a free evaluation to determine whether your website needs improvement or to ensure you can get vital website data, call us at 615.257.0057 or use our contact form.